7 Signs To Look Out For When Selecting A New Launch Condo
When it comes to property investing, everyone is searching for certainty. They want the magic formula, the one strategy that guarantees they’ll never lose money. But let’s be honest: that doesn’t exist. Markets shift, policies change, and black swan events can wipe out even the best-laid plans.
That’s why I want you to approach this guide differently. Don’t think of it as Google Maps, where you’re given exact turn-by-turn directions that guarantee you’ll reach your destination. Instead, think of it as a compass. A compass doesn’t eliminate the terrain, the obstacles, or the storms — but it does point you in the right direction.
The 7 signs I’m about to share aren’t rules carved in stone. They’re signals. The more of them you see lining up, the higher your chances of making a safe, profitable investment. The fewer of them you see, the more caution you should exercise.
So take this guide not as a prescription, but as a framework — a way to orient yourself in the property market and stack the odds in your favor.
1. Proximity to MRT: The 10-Minute Rule
One of the strongest signals for long-term demand is simple: how close the property is to an MRT station.
Studies show that around 6 in 10 Singaporeans prefer living within a 10-minute walk of a station. That’s roughly 1.1 km — close enough that most tenants and buyers will happily forgo owning a car. This preference isn’t just about convenience; it directly translates into higher rental demand, better rentability, and stronger resale liquidity.
Think of it this way: an MRT station isn’t just a train stop, it’s a permanent anchor of value. Projects within this sweet spot tend to attract more eyeballs, more tenants, and ultimately, more buyers when it’s time to exit.
On the flip side, properties that stretch beyond that comfort zone — say a 15- or 20-minute walk — may struggle to command the same level of demand. In a city where connectivity is king, distance can quickly become a dealbreaker.
2. Growth Hotspots: Following the Government’s Footprints
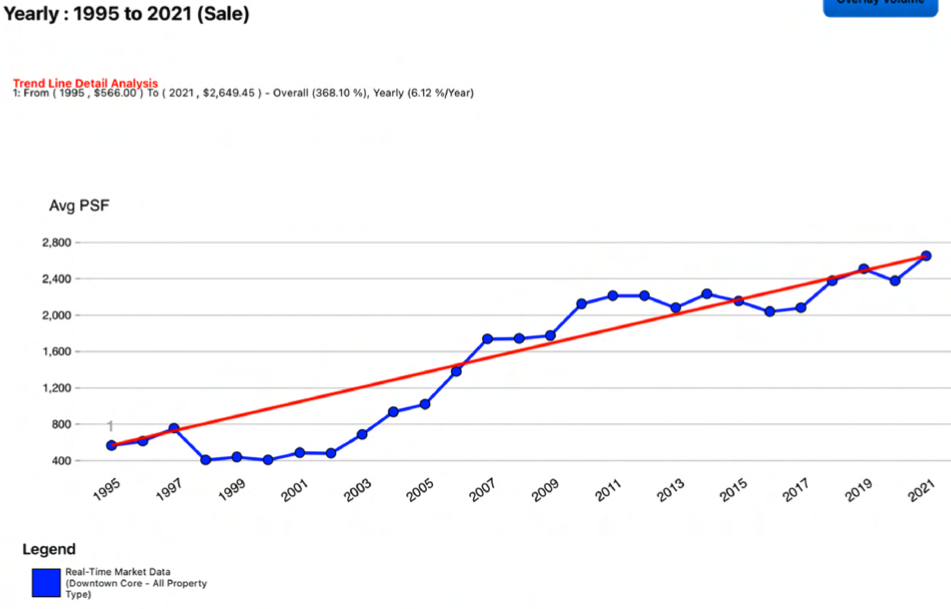
Avg PSF of properties in the Downtown Core from 1995-2021
Another powerful signal comes from understanding where the government is placing its bets. History has shown a strong correlation: when major infrastructure and transformation plans are announced, property prices in those areas tend to appreciate significantly over time.
Take Marina Bay as an example. Since the New Downtown was first announced in 1991, prices have risen by more than 368% over 31 years.

Avg PSF of properties in Sengkang from 1995-2021
Or look at Sengkang, a sleepy town in the mid-90s that transformed with new amenities and connectivity — prices there climbed 112% in 26 years. Even Jurong Lake District, which was earmarked as a business hub in 2008 (before the high-speed rail plans came in), saw prices increase by 105% in just 12 years.
The lesson? Properties in major transformation zones don’t just benefit from new malls or MRT lines. They ride on a rising tide of long-term demand, with more jobs, schools, and amenities pulling people into the area year after year.
On the other hand, areas without any transformation story — no new masterplan highlights, no significant government investment — risk stagnating. Prices there often stay flat while other estates surge ahead.
3. Future Supply: Reading the URA Masterplan

Example of escalating cost within nearby plots.
Every property’s story is shaped not just by what’s there today, but also by what’s coming tomorrow. That’s where Government Land Sales (GLS) come in. These plots are the raw ingredients developers use to build new projects, and the way they’re released tells you a lot about the long-term trajectory of an area.
In transformation zones, land isn’t released all at once. URA staggers supply over years, sometimes decades. Each new launch comes at a slightly higher breakeven cost, pushed up by land pricing, construction costs, and inflation. This creates a natural price ladder: the earlier projects become benchmarks, and subsequent launches set new reference points higher up.
For investors, the presence of many unreleased GLS plots nearby is actually a positive signal. It means there’s a long runway of growth — a pipeline of fresh projects that will steadily build demand and support higher valuations.
By contrast, areas with no GLS plots left to unlock often stagnate. Without new launches to bring in fresh demand or benchmark prices, older projects can end up stuck, overshadowed by more vibrant districts.
4. Developer’s Profit Margin
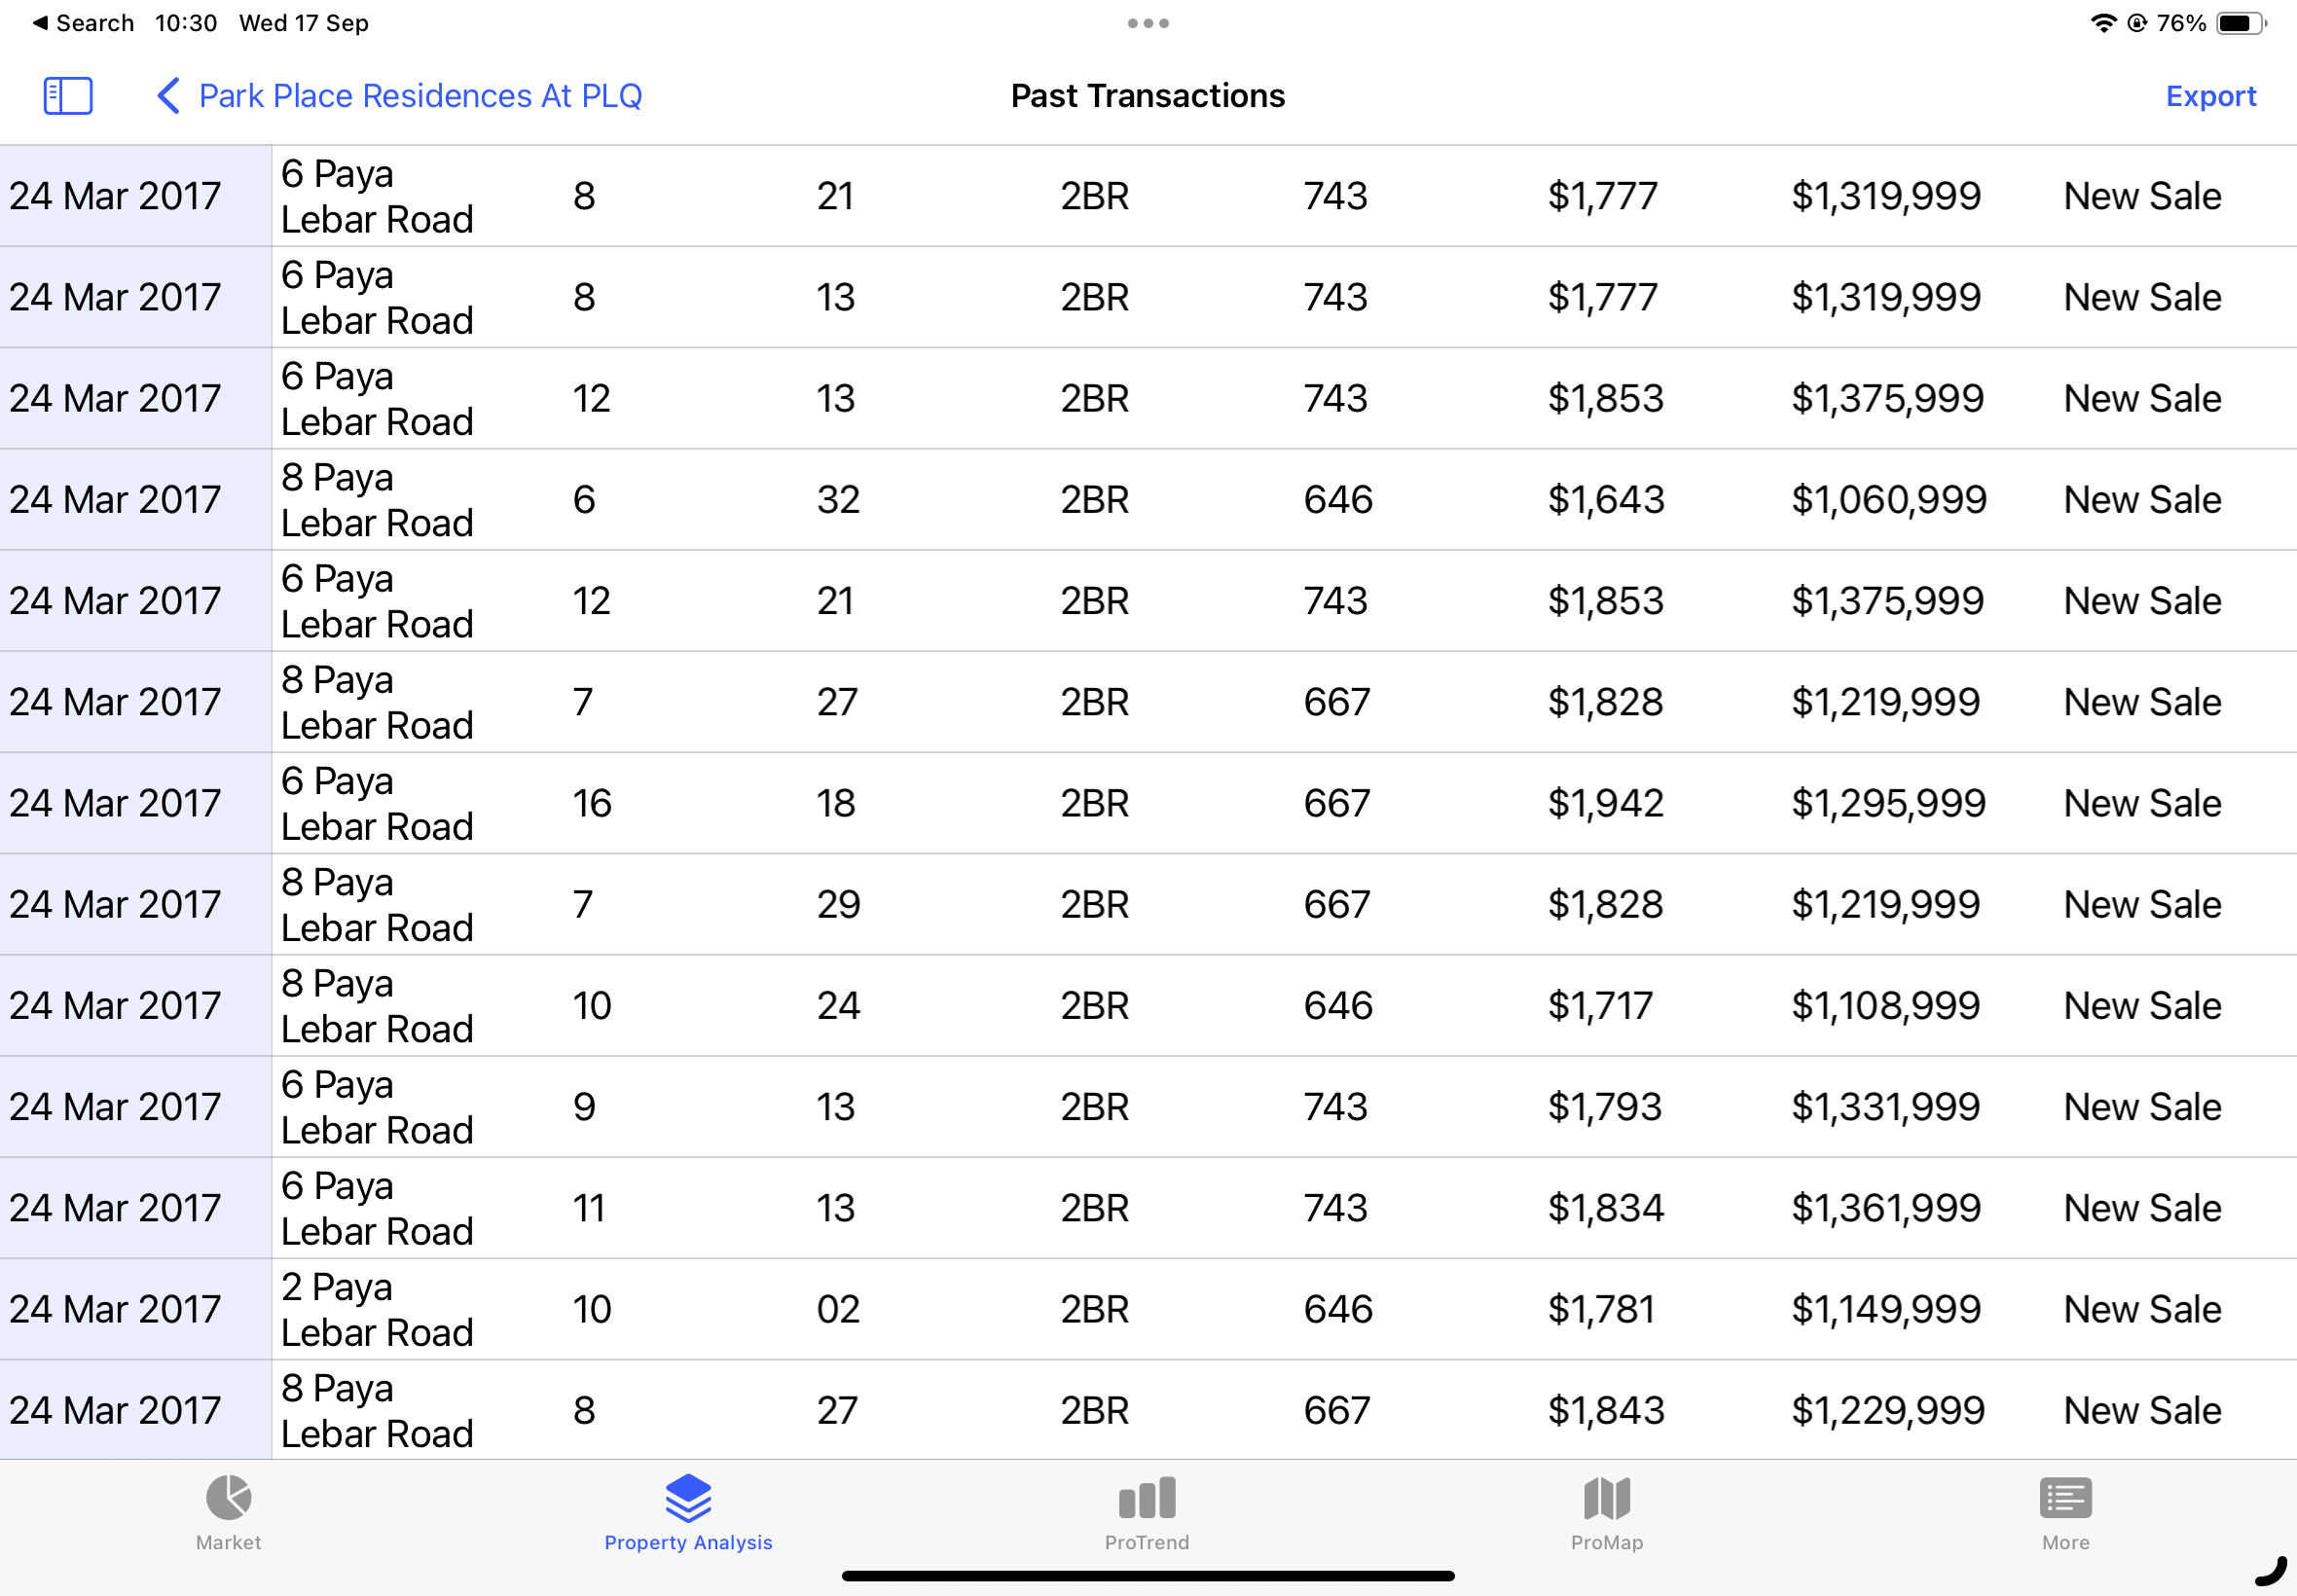
Example of loss leader strategy at Park Place Residence
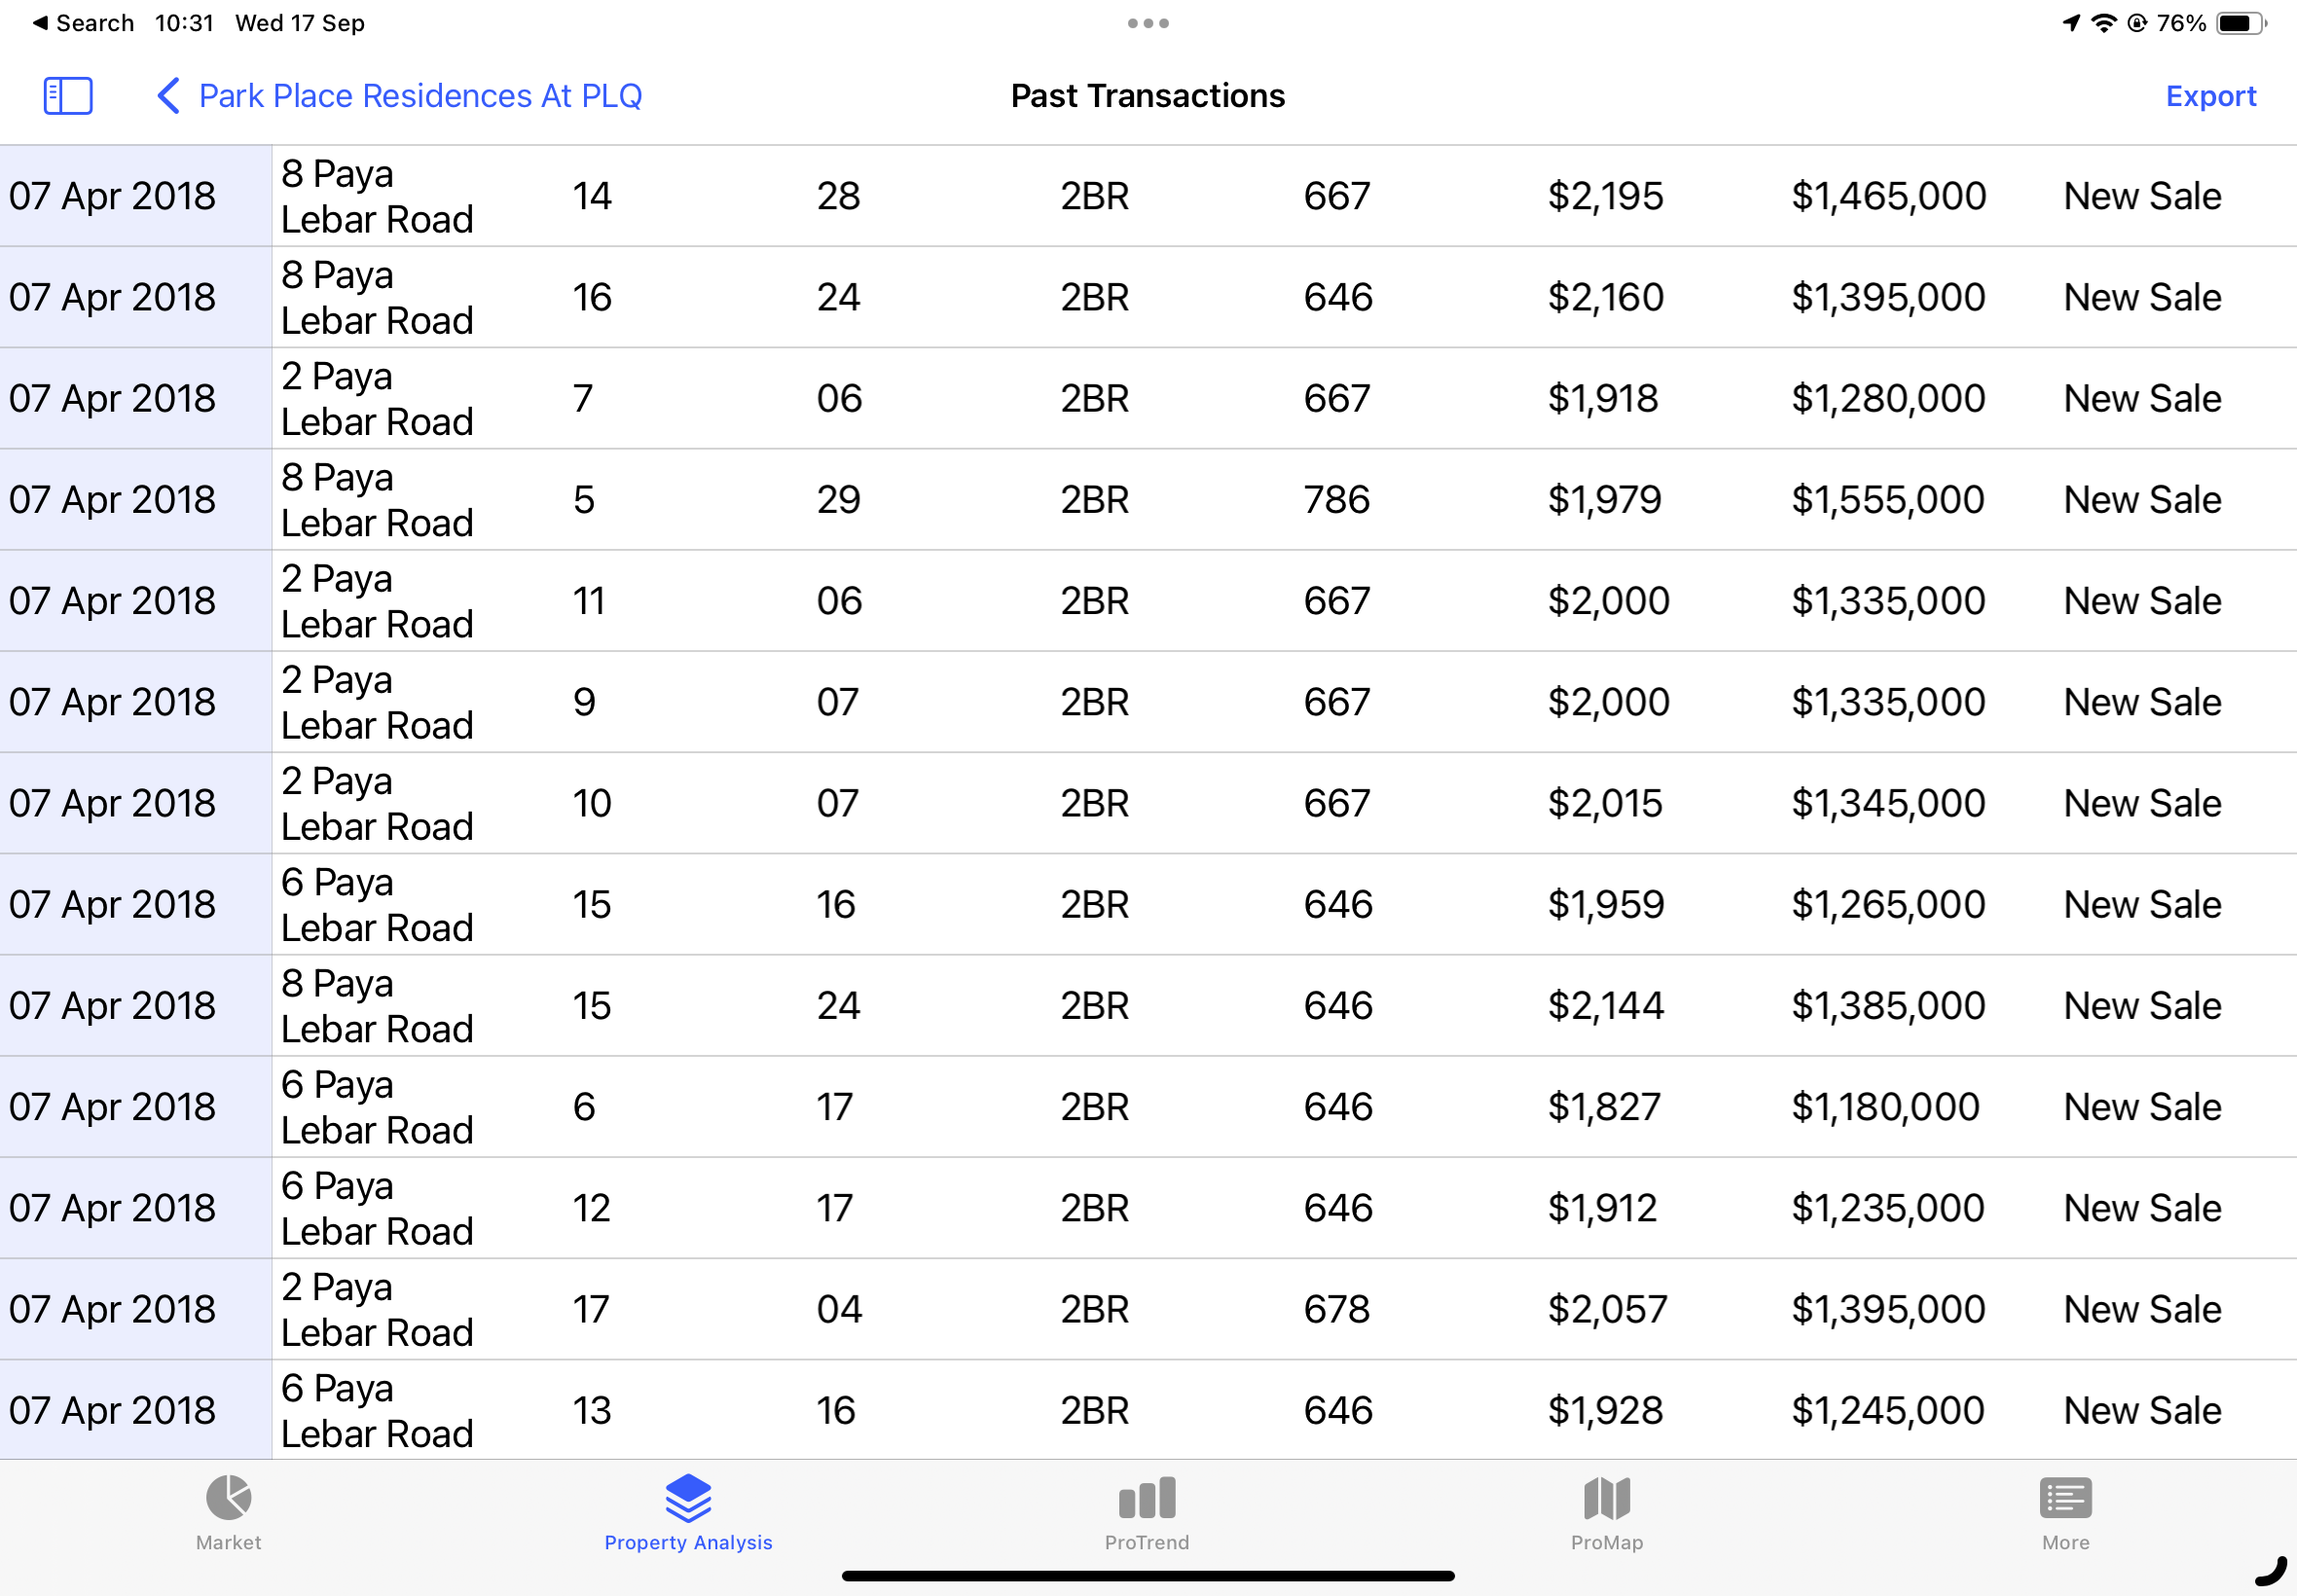
Example of loss leader strategy at Park Place Residence
Every new launch is a business venture. Developers put hundreds of millions on the line, and naturally, they expect a return. But here’s the nuance: not all margins are created equal.
At the start of a launch, developers often adopt what’s called the loss leader strategy. They release the first wave of units at slimmer margins to create buzz, secure early buyers, and unlock construction loan disbursements. For investors, these early phases can be the sweet spot — lower profit margins for the developer often translate into better entry prices for you.
Take Park Place Residences as an example. Early buyers who got in when margins were thinner enjoyed 10–15% gains within a year, simply because the developer later raised prices as their margins expanded — from about 24% at launch to 48% in later phases.
The signal here is clear: the lower the developer’s margin today, the more room there usually is for prices to climb as the project sells through. Conversely, if you’re entering when margins are already high, much of the upside may have already been baked in.
5. Rental Yields & Rentability: Following the Tenant Trail
Strong investments aren’t just about buying low and selling high — they’re also about what happens in between. That’s where rental yields come in. A property that’s easy to rent out gives you holding power, cushions your cash flow, and signals ongoing demand.
The benchmark is simple:
Around 3% yields in the Core Central Region (CCR)
3.5% in the Rest of Central Region (RCR)
4% in the Outside Central Region (OCR)
Anything significantly lower could be a red flag. It may mean the project doesn’t appeal to tenants, is aging poorly, or is competing with newer, better-located options nearby.
But yield is only half the story. You also need to think about rentability — who exactly would want to live there? A one-bedroom unit in the OCR far from an MRT may struggle, because the tenant base in that neighborhood might skew toward families, not singles. On the flip side, units near business parks, international schools, or office hubs often find ready tenants year after year.
The key is to match the property type with the tenant profile in the area. A good match means steady demand. A mismatch means vacancies, weak yields, and sleepless nights.
6. Surrounding Price Comparison & Valuation: Anchoring to Reality
In property investing, context is everything. A launch may look attractive on glossy brochures, but the real question is: how does it stack up against its neighbors?
A fair comparison means apples to apples:
New launches should be measured against other new launches.
Resales should be benchmarked against resales, with adjustments for age, remaining lease, and layout efficiency.
Here’s the trap: older leasehold projects often look much “cheaper” on a per-square-foot basis. But unless you account for lease decay, that comparison is misleading. A 20-year-old condo with 79 years left doesn’t carry the same value as a brand-new 99-year launch.
The correct way to level the playing field is to pro-rate the PSF using Bala’s Table, which models how leasehold value decays over time.
The correct way to level the playing field is to pro-rate the PSF using Bala’s Table, which models how leasehold value decays over time.
Formula (Simplified):
Adjusted PSF = (Resale PSF ÷ Value Factor at Remaining Lease) × Value Factor at 99 years
Example:
Let’s say:
- A new launch is selling at $2,200 psf.
- A 20-year-old resale nearby (79 years left) is asking $1,800 psf.
- According to Bala’s Table, 79 years ≈ 88.4% of full lease value.
Adjusted PSF = 1,800 ÷ 0.884 ≈ 2,036 psf
So the true comparison is $2,200 vs $2,036 — a much narrower gap than the raw numbers suggest.
The lesson? Don’t be fooled by sticker prices. Without proper adjustments, you could end up overestimating the “discount” on older projects.
7. HDB MOP Wave: A Demand Tailwind, Not the Only One
One of the strongest demand engines in the resale market comes from HDB upgraders hitting their Minimum Occupation Period (MOP). After roughly 9 years (construction + 5 years MOP), many families in their early 30s are ready to upgrade, supported by their CPF savings and sales proceeds.
If your new launch is in an estate with a large wave of flats reaching MOP in the next decade, you’re positioning yourself to catch a natural surge of demand. Upgraders often prefer to stay close to family, schools, and familiar routines, so condos in the same neighborhood become the default next step.
That said, MOP demand isn’t the only success factor. Many projects outside of HDB clusters have performed strongly too — especially those in prime districts (CCR trophy homes), lifestyle nodes (near waterfronts or business parks), or landmark developments that carve out their own appeal.
The key is to recognize MOP clusters as a bonus tailwind. They can tilt the odds in your favor, but they aren’t the sole compass point that determines a project’s long-term value.
TL;DR
Property investing isn’t about magic formulas — it’s about reading the signals.
Close to MRT = stronger rentability & resale demand.
Growth hotspots = ride government-backed appreciation.
GLS supply nearby = future launches push benchmarks higher.
Developer margins = thinner early = more upside.
Rental yields & tenant fit = holding power.
Fair valuations = avoid overpaying.
HDB MOP waves = built-in upgrader demand.
The more of these signals line up, the higher your chances of making a safe, profitable move.